Monitor Network Requests and Responses on Android Studio
Android Studio 3.0 has an improved Android Profiler. One nice addition in the profiler tool is that the network inspector added to Network section. Using that now we can see the network traffic originating from app in debug and see the responses as well. Those who were using Charles Proxy or similar tool will easily realise how convenient it is. We can get rid of one tool* and no more annoying HTTP proxy configuring and removing configuration after usage.
But there are few catches. First thing is it will work only if you are using HttpURLConnection or OkHttp for network calls in your app. If you are using some other libraries for network request, probably you’ll get the following message on Network profiler
“Network Profiling Data Unavailable: There is no information for the network traffic you’ve selected.”
Second issue that you may face is that you might not be able to see the network request and response in all of your devices / emulators. You’ll need a device with API 26(Android 8.0) or above. Which is a serious issue for most of the developers. Android 8.0 is the latest release, and there are only very few actual devices running that. Many flagships are still awaiting Oreo update. Simulators are here to help. But how many of us really use AVDs? I personally don’t like it. They are still very slow(Definitely improved a lot in last few years)
Now let’s see how we can actually see the request-response in Android Studio and what are the things available in that
You’ll be familiar with the following Android Profiler window which sits normally at the bottom of Android Studio. And you’ll be using it once in a while or daily.
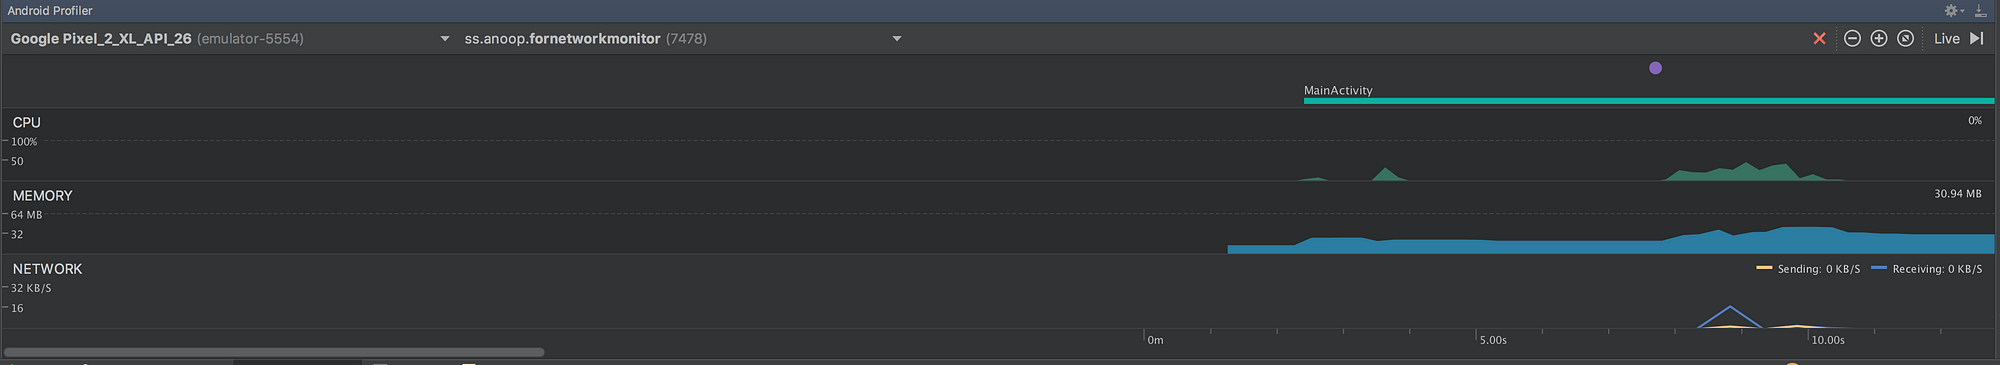
It have different profiler outputs like CPU, Memory, Network etc. Click on that network output which shows a blue and kind of orange spikes. It will expand to something like this.

The blue and orange spikes indicate received and send data respectively. So if you have a series of calls going on these spikes will be continuous. To see data that has been transferred between app and server. Select a particular region in the spike area. You can do this by dragging from start to end of the range. You’ll see something like this after selecting the area.
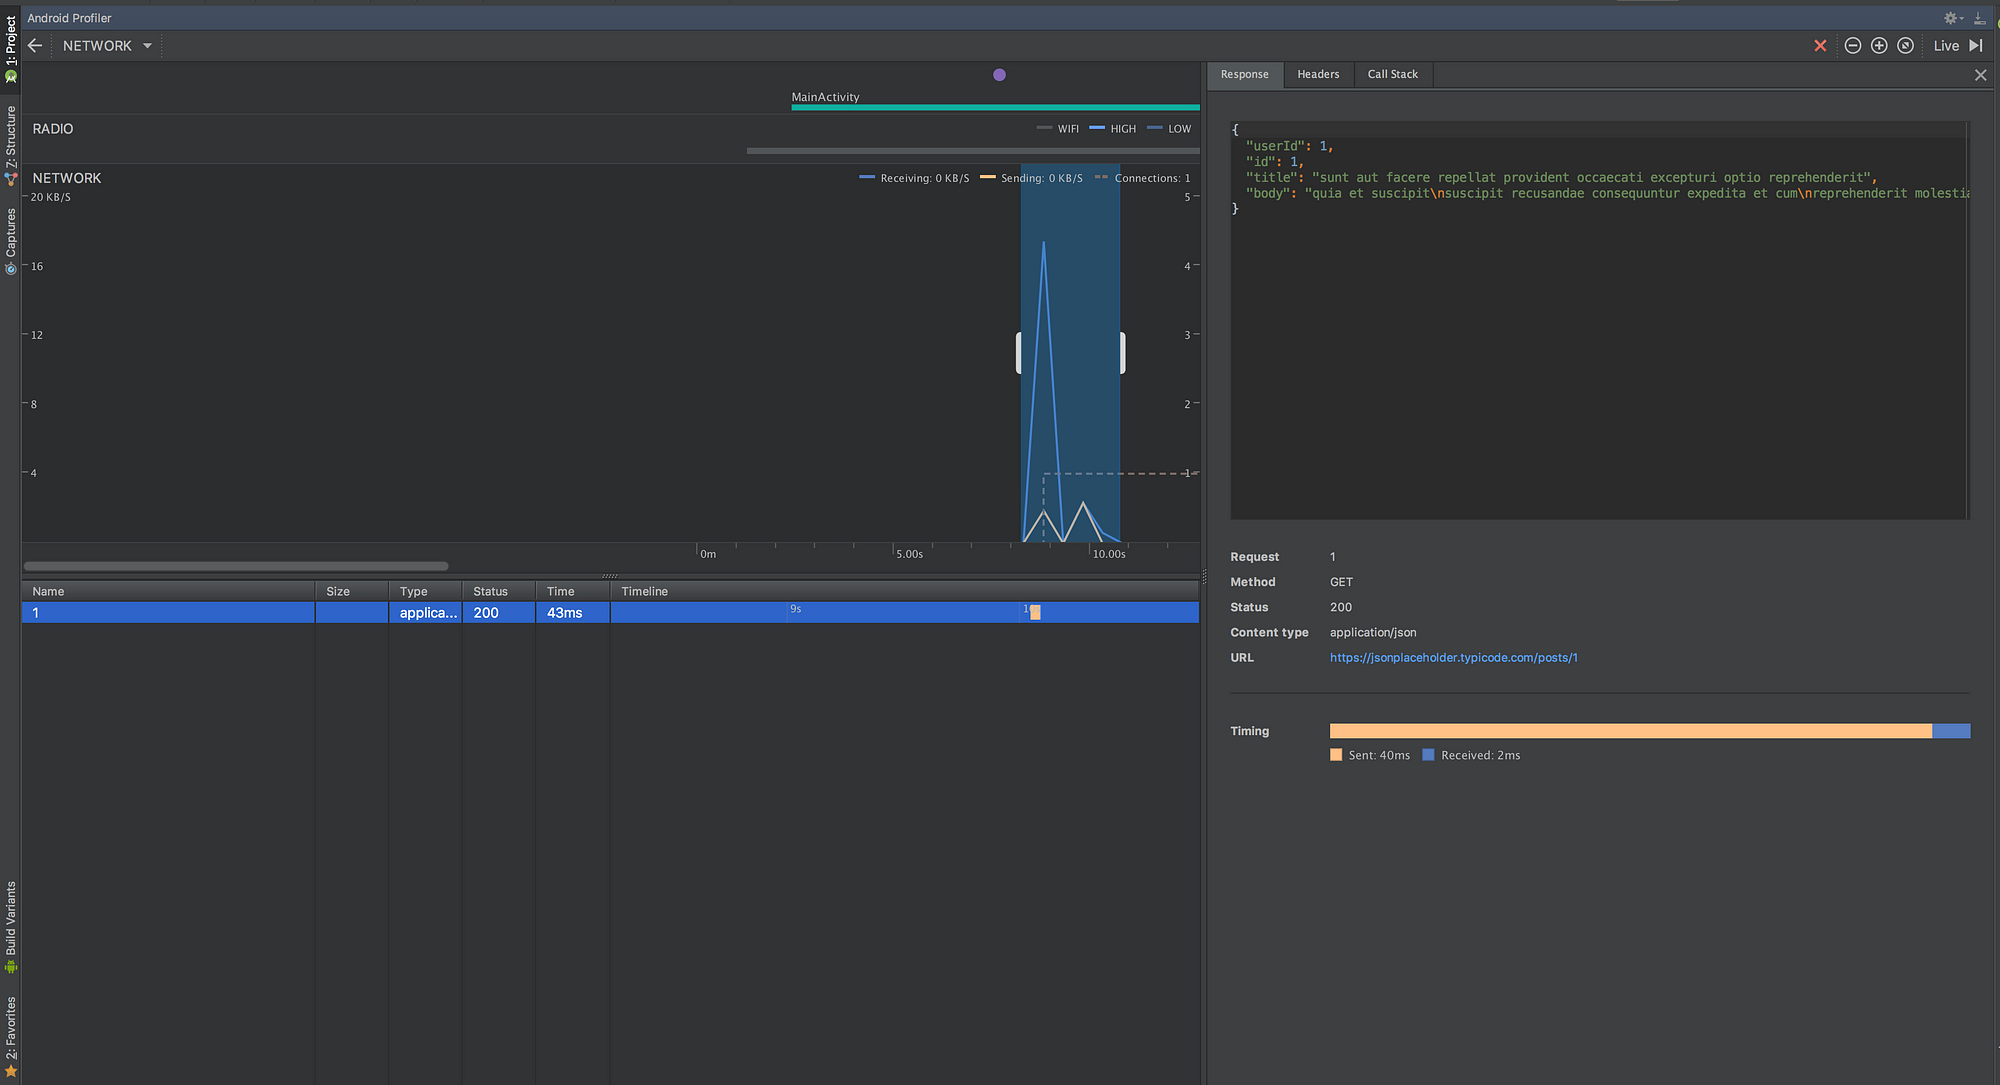
Here you can see a table below the spikes, thats the place where it lists the api calls happened between the selected range. On the right side the request response data, header etc can be inspected. In the above example name of the api is shown as one, because I have used a dummy api for this and the api was something like /posts/1.
I have tried to look into the network traffic generated from a webview. Profiler gave the default unavailable error message. I haven’t checked whether there are any tweaks to make it work. But my best guess is that it wont’t be showing data transfer originated from webviews. I will be updating that also when I have confirmation on that.
Edit 1
When Android Studio 3 was released the network monitor had the options only to view network responses and response headers. But no way to see the request params. But it is now available in the canary channel. Following is the screenshot of the above api response monitor example in Android Studio Canary 8 with request param option

So you might be wondering will it work only for API calls, or work with other web resources as well. I have tried monitoring the request and responses of image loading through some of the famous image loading libraries like Picasso, Glide, Fresco etch. Read more about it here.

